PyBamView - a web-based BAM alignment viewer
CommentsNote: updated link to live example 08/28/14
Summary: below I describe my frustration with current BAM alignment viewers for looking at alignments of short reads to regions with complex insertions and deletions, such as short tandem repeats. Then I present PyBamView, my weekend hack to build a lightweight, web-based alignment viewer that provides an easy way to view sequence alignments across multiple samples. This was largely inspired by the great but very basic, samtools tview, but with some added features and the capability to add many more.
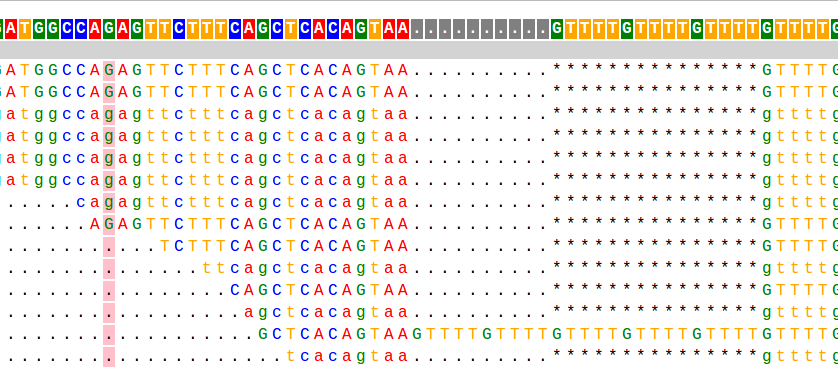
This is a taste of what it looks like:

Visit the PyBamView website and try out the live example
Note, this has only been tested on Google chrome!
Find out more about PyBamView and the motivation behind it below!
Motivation, and existing alignment viewers
Most of my work during my PhD has focused on analyzing short tandem repeats (STRs) from high throughput sequencing data. STRs are very repetitive and have large length differences from the reference genome, and so can be hard to genotype. The example alignment at the beginning of this page shows a taste of what this can look like: in that example there are several reads showing a 15bp deletion at a (GTTTT) repeat, and one read showing a 10bp insertion.When I started working on STRs, there was no good tool to genotype (determine the number of repeats) these loci from sequencing data. So one of my first projects in the Erlich lab was to develop a tool, called lobSTR for genotyping STRs.
One of the main ways of debugging a variant caller is by actually going in and looking at the raw read alignments to see if you believe the call. Let's see how three widely used genome browser tools visualize alignments at STR variants (this is not a comprehensive list of alignment viewers, or of their features, just the ones I'm most familiar with.):
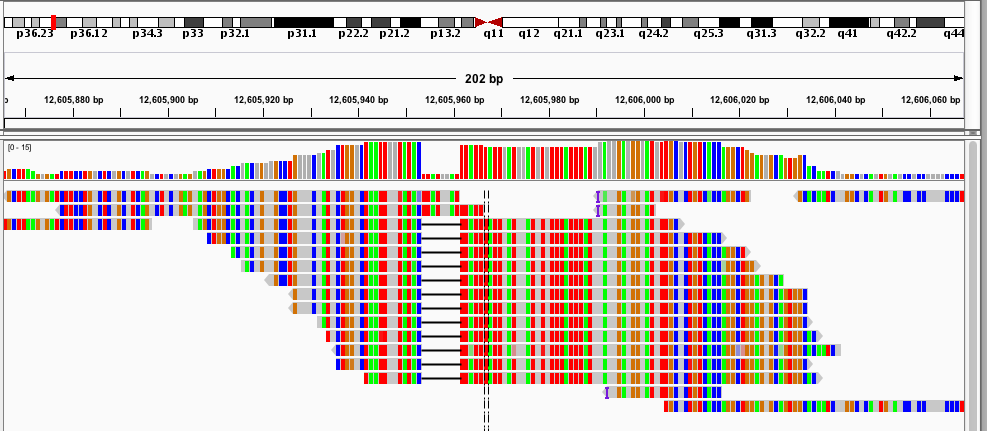
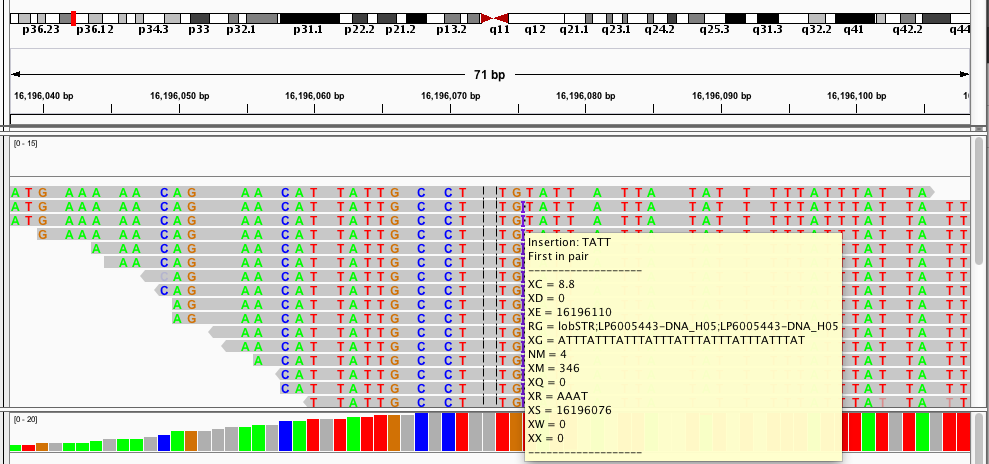
- Integrative Genomics Viewer (IGV) Here are the alignments for two different STR loci:
- UCSC Genome Browser (view
here)


Similarly to IGV, here the deletions are nicely displayed in the bams, but the insertions are indicated by a small vertical bar (which is pretty hard to see in the pictures since it's so thin).
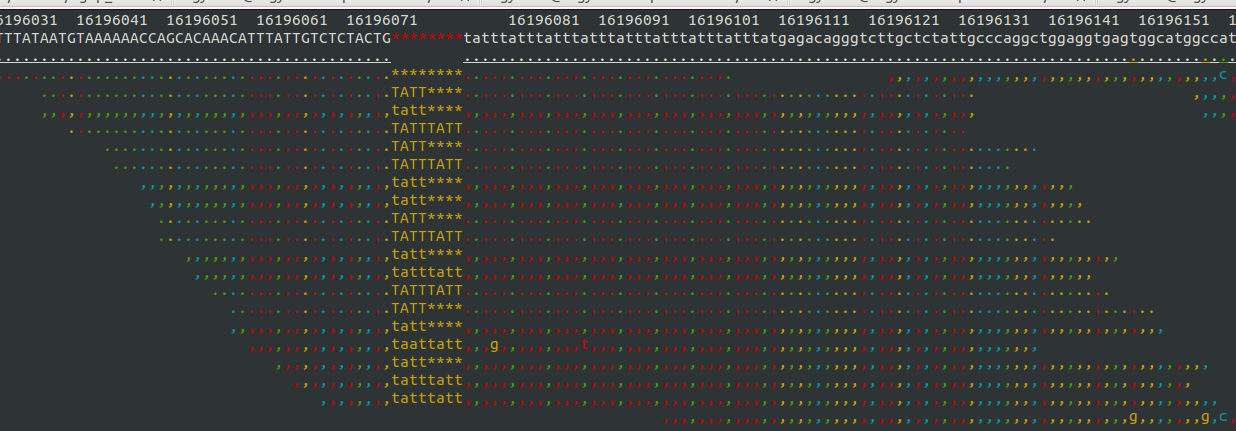
- Samtools tview (sourceforge page) Now we get to my personal favorite. Samtools tview is a very simple, fast, text-based alignment viewer run straight from the terminal. Just give it your indexed bam file and reference genome, and you get a lovely scrollable alignment. Let's look at how tview visualizes the two loci shown above:


In the first alignment, the reads indicate a deletion from the reference allele. This is indicated with a bar showing a gap in the alignment. It's very easy to tell that there's a deletion there.
In the second alignment, the reads indicate an insertion from the reference allele. The insertion is shown as a purple bar. By mousing over this purple bar, you can see the size of the insertion. Now what you can't tell by looking at this is that the alignments here are for an individual heterozygous for two different alleles, each of which is an insertion compared to the reference genome. Because IGV shows a "one size fits all" purple bar for indels, you wouldn't know this from glancing at the alignment.


This is exactly what I am looking for in terms of alignment visualization (it looks better in the terminal than it does in the screen shots). Unlike the other viewers, samtools lets you visualize the size of insertions, which it draws as *'s in the reference genome. This is apparently very difficult for the other viewers to do, probably since everything is based on the reference track (see this discussion on the IGV mailing list related to this issue.
Because tview is so minimal, it is super fast. Just enter the genomic region, snap your fingers, and you're there. Unfortunately, that's about all you can do with tview: view an alignment from a single bam file. None of the other useful features of other browser such as adding more tracks with additional datasets, viewing multiplpe alignments/tracks at once, etc.
PyBamView
So what I really want is an alignment viewer that combines the feature of samtools tview that I need (namely, good display of indels) with some of the features of the more bulky alignment viewers. Most importantly, I'd like to be able to view many samples at once. Ideally, I'd like to have features allowing me to see metadata about reads, and to combine the alignment views with information about genotype calls.I came across this post on extending samtools tview to an HTML viewer, and briefly considered trying to modify the samtools code to add some features. This idea didn't last very long after I forked the samtools github repository and found most of the tview code had been temporarily commented out (although it did look like someone was making some efforts to use read groups to look at different samples). Uncommenting the tview code led to compilation errors, and I decided that Heng Li's (amazing) code is just a bit (a lot??) beyond my comfort level in C. So I decided to see if I could get something simple to work as a Python-based (of course!) web application.
Getting something primitive up and running was suprisingly simple. You can view and play around with the example of what there is so far here and get download/install/usage information here.
And here are the two loci used as examples above:


I have already found this super useful in visualizing our STR calls, and it would likely be useful for people whose lives don't revolve around STRs as well :). If you want to hear more about how it works, and what I hope to add in the future, keep reading!
P.S. I should have timed the process for how long it took me to get each of these running. PyBamView and tview took about 10 seconds each to load from the terminal. IGV and UCSC took much longer (although to be fair my slow internet at home is a lot to blame). Still for UCSC I had to upload my BAM file to a public URL, make a track, and load the page. For IGV, I had to launch IGV, figure out it doesn't work with my Java configuration, download from source, load the reference genome, and load my bam, all of which took much longer than I'm willing to admit.
PyBamView: how it works and what it does
PyBamView is a simple web application for visualizing alignments from bam files. You supply it with bam files on your local computer or server, along with an optional reference genome, then view the alignments in your web browser. To call it from the command line, simply type something like:pybamview --bamdir $DIRECTORY_WITH_BAM_FILES --ref $REFERENCE_FASTA Flask for simple python web servers
PyBamView was built using the Python Flask library, combined with the jinja2 template engine. Using these tools, it is very easy to create an "application" that ties specific python functions to call to generate the HTML (+ javascript, css, etc.) for specific URLs. For example, I can do something like:app = Flask(__name__)
@app.route('/<string:bamfiles>')
def display_bam(bamfiles):
... do something with bamfiles and generate html...Displaying alignments
Read alignments are parsed from the CIGAR scores from the BAM file and displayed simply as HTML tables. There is a separate table for the reference genome at the top, and for each sample. Each column represents a position in the genome (mouseover a column to see which position it is). Gaps are displayed as "*"'s.It would be pretty inefficient to load the whole human (or other) genome into your web browser, so PyBamView only loads chunks of the genomes at a time on demand. Because the BAM files are indexed, when given a genomic region we can immediately retrieve the reads in that region. This is done using the pysam library. A buffer of several hundred base pairs around the request region is loaded so you can scroll a little upstream and downstream of the region input to the search bar.
Future developments
There are many things on the todo list. On the immediate list to add is:- Highlight base mismatches from the reference genome
- Deal with cases in bam files that aren't dealt with yet (clipping, etc.)
Of course, if you're interested in some features or would like to contribute, found some bugs (which there are certainly going to be) or have any feedback at all, please comment below, or send me an email at (mgymrek AT mit DOT edu).
comments powered by Disqus